

Make infographics with these 2 essential skills
Let’s talk about making graphics, especially infographics.
Today’s post is a rewrite of a thread from my I Am SciComm takeover. Feel free to comment or contact me with any followup questions.
Topics in today’s post:
How do you make infographics? What makes a good infographic?
Later in this post, I’ll share with you my personal method for simplifying science into a concise amount of text for an infographic. But first, let’s just talk about what makes a good infographic.
A good infographic should stand on its own. It should hold all the details necessary to understand it. Even if you’ve defined the term in the text, you can (i.e., should) put important definitions in the graphic.
A good infographic shouldn’t try to do everything at once. I often ask people to try to sum up their graphic in just a sentence or two. If you can do that, you’re on the right track. As soon as you start adding in a ton of side details, things get murky.
Removing details is often the hardest thing for us as scientists to do. We value the details because we understand why they are important. But when communicating outside your field, especially the public, details can confuse things. If you really need more details, maybe an infographic is not the right medium. Maybe a comic or animation would be better?
A good infographic should reuse elements to help people understand what’s going on. For example, when building models in biology, we often use an arrow to mean “activates” and a T shape to mean “inhibits”. This consistency is really helpful in #SciArt!
I also personally believe that a good infographic uses color with
Let your design breathe! E
Don’t forget that you want people to be able to read your text. Choose fonts, text size, and text color with care. I often just stick with Arial or an equivalent sans serif font.
(TBH, I have no problem with Comic Sans because it’s adorbs, but I rarely have a project where it’s appropriate)
One more thing. What’s the point of an Infographic if it’s 99% text? Find creative ways to tell your story visually. Not thinking of it as a story? That’s a good place to start!
Simplifying science for infographics
Alright, ready to learn my approach for simplifying science?
The very first thing you should decide for your infographic is the size. Is this going to go on Instagram (1080 x 1080 px), will it be printed in a magazine (8.5 x 11″), is it for a sidebar on a website? This is going to dictate how much space you have.
Print infographics often need a lot more extra padding around the edges, so the amount of space is even less. But web graphics sometimes need larger text, which limits space. The same infographic can sort of work on different mediums, but not really. So knowing format becomes important!
I divide the content for my infographics into 4 categories:
The absolute FIRST thing I identify when starting an infographic is the MAIN POINT. This point defines the infographic, both what visuals I need and what text I need.
After talking with a client about their research, I typically ask “What’s the one thing you want people to remember when they leave the infographic?” Many actually find this a bit difficult at first, but after a moment of thought, it’s obvious to them.
Identifying the ESSENTIAL BACKGROUND information is also important. This gives a clear idea of the starting point for the story. I usually limit background to 2 sentences.
Once I have framed the story, I try to come up with a title. Should be short and accurate, but the title is mainly to grab a reader’s attention. If the audience gives your infographic only 3-5 seconds, they’ll see the images and the title.
Think about how you decide which articles to read, or which posters to look at during a poster session. I definitely look at titles and figures to decide if I’m interested. (Maybe that’s just me?)
It may seem counterintuitive, but I write the content LAST. By this point, I know the beginning (A) and end (B) of the story. I need to figure out how to get from A to B in the most concise but complete way possible.
This is the hardest step for the scientists I work with. What they think is important (because IT IS important to the research) may not be pivotal to the infographic. Some things will distract from the main point.
This is a hard but worthwhile step!
EVERY detail is not important. The point is to get someone excited, not to replace a book chapter or a dissertation. As I said earlier, if you have more points to get across, consider a comic or video series.
These tips are to help you solve the first of the two hard talents in making infographics: simplifying science. Now let’s discuss a few ways to handle the second talent: making art.
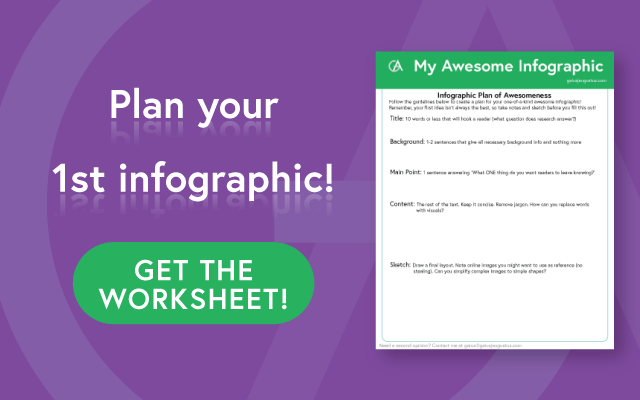
Get organized with this worksheet!
Bring out the artist in you when drawing infographics
Hey, #SciComm-ers!
Let’s talk about how to deal with that pesky art side of making infographics! ?
To me, the most important part of doing…well, almost anything is knowing the basic principles.
So let’s talk about some principles that will help you with your infographic designs OR for giving constructive criticism of other’s designs.
Just like science, art comes more easily to some people than others, but with time, practice and learning, you can become better and better.
First, let’s talk about typography. You obviously want your text to be readable, right? The best advice I can give you is to keep text simple. Reserve fancy (also known as “display”) fonts for special use cases only, or never use them at all. Use sans serif fonts (like Arial) for headings and text. And if you just adore serif fonts (like times new roman), only use them in the text.
Exceptions exist, of course, especially if you’re doing a highly themed piece.
Also, don’t justify or center your text unless you have a good reason for doing so.
What are good reasons to justify? Check this out.
When do I use centering? For emphasis, especially when I write titles.
What about color?
I’ll tell you a secret. You can find color palettes online. I have a Pinterest board full of color palettes. Some work better for some projects than others.
In general, I try to pick a few colors that are around the same shade and then add an accent color.
For example, here on my website, I went with bright blue-greens and an accent of orange.
And for almost every design, I usually keep white and black around for contrast.
There are enough principles of design to keep you here all night (day?), so I’m going to point you to a set of 3 videos that I think highlight some of the most important ones.
https://youtu.be/w7HTNAr8ECE
https://youtu.be/5vBkL_zqTsc
https://youtu.be/3MIkOhXAjEI
all by @echoechor
I’m also a firm believer that you can get started with infographics by using simple shapes. You often just need to think outside the box. For example, Powerpoint has all these shapes available! You can use them or combine them to create interesting art.
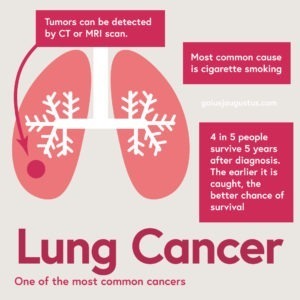
Here’s an example from my own library. This was done with Adobe Illustrator, but using only rectangles, circles, lines, and rounded rectangles. The lung shape? It’s just an altered circle!
You can do this, too! It’s just a matter of playing around with it.
I’m working on a series of blog posts to teach these methods in Adobe Illustrator. If you’re interested, you can sign up for my newsletter to find out about new blog posts, or just check by every once in a while.
Sorry the posts aren’t available yet! I’m working on them slowly.
I’m also planning to do the same w free/less expensive tools! You shouldn’t have to be rich to get started!
The real message:
Just like science, you can find tools and gain skills. But learning some basic principles can take you far!
I’ll stop here. If you have questions, I’m happy to answer!